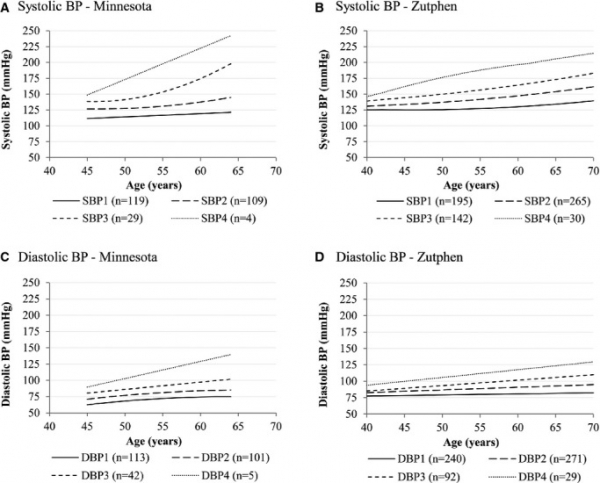
Ten-year blood pressure trajectories were identified in the Minnesota Business and Professional Men Study and the Zutphen Study. Blood pressure trajectories were the strongest predictors of mortality in Minnesota and average blood pressure was the strongest predictor in Zutphen. The steepest systolic blood pressure trajectory was associated with 4 times greater cardiovascular mortality risk in Minnesota and 2 times greater risk in Zutphen, compared to the lowest trajectory. In both cohorts the BP trajectories were associated with a 2 times greater risk of all-cause mortality. The number of life years lost comparing these trajectories was 8 years in Minnesota and 4 years in Zutphen.

Trajectories of systolic (A-B) blood pressure in 261 American middle-aged men in 1947-1957 and 632 middle-aged Dutch men in 1960-1970. Tielemans 2015. DBP indicates diastolic blood pressure; SBP, systolic blood pressure.
Description of two long-term cohorts in the United States and The Netherlands
For this analysis two prospective and nearly extinct cohorts were used of middle-aged men: the Minnesota Business and Professional Men Study (n=261) and the Zutphen Study (n=632). Blood pressure was measured annually from 1947-1957 in Minnesota and from 1960-1970 in Zutphen. Ten-year blood pressure trajectories were identified by latent mixture modeling. Mean initial age was about 50 years in both cohorts. After 10 years of blood pressure measurements, men were followed until death, on average 20 years later. All Minnesota men and 98% of the Zutphen men were followed until death.
